The Pacific Island state of Fiji is an ethnically divided country with a history of political tension resulting in several coup d’etats. The two major ethnic groups are the indigenous Fijians and the Indo-Fijians. (The Indo-Fijians are primarily the descendants of indentured laborers brought by British colonists from India to work on sugar plantations during the 19th century.) These two groups are roughly equal in size – according to the 1996 census, 51.1 percent of the population is indigenous Fijian and 43.4 percent Indian.
Since independence in 1970, indigenous Fijians and Indo-Fijians have cast votes in separate communal constituencies, although under two of the three constitutions since 1970, “open” constituencies have also existed. Political parties tend to be ethnically identified and voting is, for the most part, ethnically-based. Because the population is approximately balanced, electoral victory tends to be dependent on the results in the open constituencies. The delimitation of constituency boundaries, especially open constituencies, is therefore of considerable significance in Fiji.
Historical Background
Following independence from Britain in 1970, Fiji appeared to make a relatively successful transition to multi-ethnic democracy. But in 1987, following the election of a government seen by the indigenous Fijian-dominated military as overly close to the Indo-Fijian community, two coups occurred. Eventually a new constitution, with provisions that weighed strongly in favor of the indigenous population, was promulgated.
The 1990 Constitution adopted a new electoral system based entirely on communal representation of ethnic groups, with separate electoral rolls for Fijians, Indians and “general electors”. The indigenous Fijian population was guaranteed primacy in most senior government and administrative positions, including the office of the prime minister; the Indo-Fijian population, on the other hand, was under-represented in government relative to its proportion of the population.
In 1994, following economic difficulties, international condemnation (including expulsion from the Commonwealth of Nations) and a high level of emigration by the Indian community, the Fiji government established a Constitution Review Commission to re-examine the constitution and recommend a less biased form of representation. The Commission ultimately recommended a new constitution containing an innovative package of electoral arrangements designed to encourage the development of multi-ethnic politics in Fiji. One of these recommendations was the adoption of an Alternative Vote System [1].
The 1997 Constitution as approved included the recommended preferential voting system. However, the constitution also retained communal seats: two-thirds of the seats in the new parliament were to be elected on a communal basis, the remaining one-third of the parliamentary seats were to be elected from an open electoral roll.
Elections under the new constitution were held in May 1999. These elections ended in a surprise victory for the Indo-Fijian party, the Fiji Labour Party (FLP), and Fiji’s first Indo-Fijian Prime Minister, Mahendra Chaudhry. One year later, on May 19, 2000, the Prime Minister and other high-ranking government officials were taken hostage in the parliament building by an armed group led by George Speight, a member of a radical group of indigenous Fijian nationalists. Chaudry’s government was dissolved, martial law was declared and the 1997 Constitution was abrogated.
In July 2000, the military transferred power to an interim administration (one that had not been elected) and indigenous Fijian Laisenia Qarase was sworn in as Prime Minster. Following significant pressure from the international community, the interim administration held elections in August 2001 under the provisions of the 1997 Constitution [2].
The electorate voted mainly along ethnic lines and the political party of the interim Prime Minister Qarase won the most seats (31) in the 71 seat parliament; the deposed Prime Minister’s Fiji Labour Party came in second with 27 seats. Mr. Qarase was sworn in as Fiji’s new Prime Minster on 10 September 2001. (The next election is to be held in September 2006.)
Electoral System
The bicameral parliament of Fiji is composed of an appointed Senate [3] and an elected House of Representatives. The 71 members of the House of Representatives are directly elected from single-member constituencies by a preferential voting system.
The 71 legislative constituencies are comprised of 46 “communal” constituencies and 25 “open” constituencies, with the members elected as follows:
- 46 members are elected by voters registered on one of 4 separate electoral rolls:
- 23 are elected from a roll of voters who are registered as indigenous Fijians
- 19 are elected from a roll of voters who are registered as Indians
- 1 is elected from a roll of voters who are registered as Rotumans
- 3 are elected from a roll of voters who are not registered as Fijians, Indians or Rotumans (this is the “general voters” roll)
- 25 members are elected by voters from all communities registered on an open electoral roll
The outcome of an election depends heavily on the demographic distribution of ethnic groups and the way in which electoral boundaries – particularly the open seats – are drawn.
Legal Framework for Delimitation
Boundary Authority The 1997 Constitution dictates that delimitation (redistribution) be undertaken by a Constituency Boundaries Commission composed of three persons:
- A chairperson, who must be, or is qualified to be, a judge. The chairperson is appointed by the President, acting in his or her own judgment, following consultation with the Prime Minister and the Leader of the Opposition.
- Two additional members, both appointed by the President, one on the nomination of the Prime Minister and the other on the nomination of the Leader of the Opposition.
A person cannot be appointed as a member of the Commission if he or she is, or has been at any time during the past four years, a member of Parliament, or another representative body, or a member of a state service.
Final Authority Although the Commission must report its final determination to the House of Representatives, together with a summary of any objections made to it and the reasons for its final determination, the legislature does not vote on the determination and cannot veto it. Subject to the jurisdiction of a court to entertain an application for judicial review [4], the decision of the Commission is final.
Public Input into the Process Whenever the Constituency Boundaries Commission proposes to alter a boundary, it must publish a notice and invite submissions from political parties, members of the House of Representatives and any other person or body wishing to make a submission. The invitation for submissions must specify a period of not less than 60 days for the making of submissions.
Notice must be placed in the daily newspapers and played on local radio stations indicating where anyone interested may inspect maps showing the provisional boundaries and a summary of the reasons for the provisional boundaries. The notice must also indicate the last day on which the Constituency Boundaries Commission will receive written objections to the provisional boundaries.
If any objections are received, the Constituency Boundaries Commission must publish an announcement specifying the places where the objections are available for public inspection and the last day on which the Commission will receive counter-objections, being not less than 21 days after the date of publication of the notice.
After considering any objections and counter-objections, the Constituency Boundaries Commission makes a final determination and produces a report outlining the basis for its final determination and submits this report to Parliament.
Timing of Redistributions The Constituency Boundaries Commission must, in the year following each official census, review the boundaries and determine whether or not the boundaries should be changed to ensure compliance with established redistribution criteria.
Criteria for Redistributions The Constitution specifies a number of criteria the Commission must follow when drawing constituency boundaries, depending on the type of constituency [5].
In determining the boundaries of the 23 Fijian communal seats, the Commission must ensure that the boundaries for 17 of the constituencies are in accordance with the provincial boundaries, with the provinces of Ba, Tailevu and Cakaudrove comprising two constituencies each, and the other provinces each comprising one constituency. The remaining 6 Fijian constituencies are to be composed of predominately urban areas in which the number of voters is to be, as far as reasonably practicable, equal.
The boundaries for the remaining 23 communal seats (19 Indian, 1 Rotuman and 3 General seats) are to be drawn in such a manner that each seat has roughly the same number of voters within its own communal category.
The boundaries for the 25 open constituencies are to be drawn so that each constituency has roughly the same number of voters and “a good proportion of members of the different ethnic groups.”
In addition, the Commission must give due consideration to:
- the constituency’s physical features
- the boundaries of existing administrative and recognized traditional areas
- means of communication and travel within the proposed constituency
1998 Delimitation Exercise
Both the 1999 and 2001 parliamentary elections were conducted using the constituency boundaries created by the 1998 Constituency Boundaries Commission [6].
The 1998 Commission divided the Fiji Islands into the requisite 71 constituencies. Of these, 25 constituencies are “open seats” where candidates and voters are from any ethnic group. The other 46 constituencies are communal seats in which a voter casts a vote only for candidates from his or her own ethnic community. In the Fijian communal constituencies, for example, only indigenous Fijians vote for indigenous Fijian candidates; in the Indo-Fijian constituencies, only Indo-Fijians vote for Indo-Fijian candidates. There are 23 communal seats for indigenous Fijians, 19 for Indo-Fijians, 1 for Rotumans and 3 for general electors (for those who are not on any of the other rolls).
Each elector appears on two rolls – one for the open seat and one for the communal, or racially-reserved, seat – and each voter casts two votes, one for an open seat representative and one for a communal seat representative. (There are actually two sets of constituency boundaries drawn for the country: a set of 46 communal constituencies that encompass the entire country and a set of 25 open constituencies that also encompass the entire country.)
Rural Fiji has high territorial segregation, and the outer islands are almost entirely indigenous Fijian. The main island and urban centers are more ethnically mixed and constituencies could be drawn in these areas that are, at least in part, more ethnically diverse.
Communal Constituencies According to the Constitution, the boundaries of most of the communal constituencies are to be drawn so that each constituency has roughly the same number of voters within its own communal category – for example, the 19 Indian constituencies should each have about the same number of Indo-Fijian voters. However, the Constitution places additional constraints on the 23 Fijian constituencies: the boundaries of 17 of the constituencies are to follow the provincial boundaries; the other six Fijian communal constituencies must be predominately urban.
As a result of these requirements, the populations of the constituencies vary quite dramatically. Table 1, below, lists the average number of voters for each type of communal seat, as well as for the open seats. (Appendix A provides the populations of all 71 constituencies for both the 1999 election and the 2001 election.)
Table 1: Average Population by Seat Type,1999 Electoral Constituencies[1]
|
Type of Seat
|
Number of Seats
|
Number of Voters
|
Average Number of Voters Per Seat
|
|
Fijian Reserved Seats
|
|
|
|
|
· Provincial (Rural)
|
17
|
143889
|
8464
|
|
· Urban
|
6
|
76375
|
12729
|
|
· Total
|
23
|
220264
|
9577
|
|
Indian Reserved Seats
|
19
|
197621
|
10401
|
|
Rotuman Reserved Seat
|
1
|
5232
|
5232
|
|
General Reserved Seats
|
3
|
14029
|
4676
|
|
Total Reserved Seats
|
46
|
437146
|
9503
|
|
Open Seats
|
25
|
437146
|
17486
|
The population quota for the 46 communal seats was 9503 in 1999 [8], but the average number of voters per type of seat varied substantially from this quota. The provincial Fijian reserved seats were, on average, smaller than the population quota (the average number of voters in 1999 for these seats was 8464, but the actual range in seat population was from 2856 to 16051 voters), while the Fijian urban reserved seats were, on average, much larger than the population quota. The Indian reserved seats were also, on average, larger than the population quota. The general reserved seats, and the seat reserved for Rotumans, were, however, considerably smaller than the population quota.
The total percent population deviation for the 46 communal seats was very close to 140%. This is quite high; most consolidated democracies that have established tolerance limits for population deviations have set the limit at around plus/minus 10 percent, producing a total population deviation of no more than 20 percent. On the other hand, the total percent population deviation for the open seats was substantially smaller in 1999: only 29 percent.
Open Seats According to the 1997 Constitution, the Constituency Boundaries Commission must give due consideration to the principle that “voters should comprise a good portion of members of different ethnic communities.” However, the 1998 Constituency Boundaries Commission found that achieving ethnic parity in the 25 open constituencies was “impossible” and instead opted to “provide that the overall balance of the ethnic communities was maintained over the 25 open seats.” [9] This was done by distributing majority ethnic Fijian and majority Indo-Fijian constituencies roughly in proportion to their respective weights in the national population.
The Commission created 10 open seats in which Fijian voters composed over 55% of the total voters. Indian voters made up over 55% of the total voters in 8 open seats, and were a majority (between 50 and 55% of the voters) in an additional 3 seats. (Appendix B provides the ethnic composition – percent indigenous Fijian, Indian, Rotuman, and general – of the open constituencies when they were drawn.)
The Figure below, reprinted from an article written by Jon Fraenkel [10], illustrates the ethnic profile of the open seats:
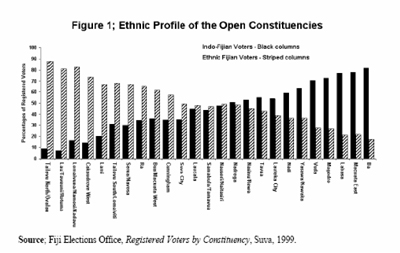
Only a few of the open seats created by the Commission were truly ethnically mixed. These seats included:
- Nausori / Naitasiri: 49% Fijian and 48% Indian
- Nasinu / Naitasiri: 49% Fijian and 48% Indian
- Laucala: 48% Fijian and 45% Indian
- Samabula / Tamavua: 47% Fijian and 44% Indian
- Suva City: 49% Fijian, 35% Indian and 11% General
- Nadroga: 48% Fijian and 51% Indian
These ethnically mixed open seats proved pivotal in the 1999 and 2001 elections.
Results of the 1999 and 2001 Parliamentary Elections
Since independence in 1970, electoral contests in Fiji have been marked by ethnic conflict between indigenous Fijian-supported and Indian-supported political parties. The indigenous Fijian communal seats have consistently elected representatives from a separate set of parties as the Indian communal seats. As a consequence, the election has typically been decided by the open seats (when they have existed), and the most important open seats have been those with a heterogeneous population. The two most recent elections – 1999 and 2001 – are no exceptions to this rule.
1999 Parliamentary Elections Voting in 1999 was strongly along ethnic lines.
Table 2 displays the results of the election by type of seat. [11]
|
|
FLP
|
FAP
|
SVT
|
PANU
|
VLV
|
UGP
|
NVTLP
|
INDP
|
|
Open
|
18
|
2
|
3
|
0
|
0
|
1
|
0
|
1
|
|
Fijian
|
0
|
9
|
5
|
4
|
3
|
0
|
1
|
1
|
|
Indian
|
19
|
0
|
0
|
0
|
0
|
0
|
0
|
0
|
|
General
|
0
|
0
|
0
|
0
|
0
|
1
|
0
|
2
|
|
Rotuman
|
0
|
0
|
0
|
0
|
0
|
0
|
0
|
1
|
|
Total
|
37
|
11
|
8
|
4
|
3
|
2
|
1
|
5
|
FLP Fiji Labour Party
FAP Fijian Association Party
SVT Soqosoqo ni Vakavulewa ni Taukei
PANU Party of National Unity
VLV Veitokani ni Lewenivanua Vakarisito
UGP United General Party
NVTLP Nationalist Party
INDP Independents
All 19 of the Indian reserved seats went to the Fiji Labour Party (FLP), but not a single one of the Fijian communal seats went to the FLP. Five major Fijian parties split among themselves 22 of the 23 reserved indigenous Fijian seats, but not one of these parties carried a single Indian seat. In fact, the largely Indian-supported parties (the FLP and the National Federal Party (NFP), which obtained a substantial portion of the Indian vote but no seats) obtained less than 2 percent of the indigenous Fijian vote, while the largely Fijian-supported parties received less than 1 percent of the Indian vote.
As Table 2 indicates, the Indian-supported FLP won the election with 37 seats, primarily because indigenous Fijian voters split their votes across five parties and the vast majority of open seats went to the FLP. The FLP not only carried the open seats in which Indian voters were a majority (which the FLP usually won on the first count), but also number of open seats in which the transfer of votes (Fiji has an Alternative Vote System) ultimately led to a victory for the FLP [12].
The Indian-backed FLP, after managing to secure an absolute majority of the seats, named their leader, Mahendra Chaudry, as the country’s first Indian Prime Minister. One year later, George Speight marched into Parliament and took the Prime Minister and most of his cabinet hostage. Although the coup was eventually defeated, a caretaker regime, composed largely of indigenous Fijians, was installed and new elections were called for August 2001.
2001 Parliamentary Elections The results of this election are listed in Table 3.
Table 3: Results of 2001 Parliamentary Election[13]
|
Type of Seat
|
Political Party
|
|
FLP
|
SDL
|
MV
|
NFP
|
NLUP
|
UGP
|
INDP
|
|
Open
|
8
|
13
|
1
|
1
|
1
|
0
|
1
|
|
Fijian
|
0
|
18
|
5
|
0
|
0
|
0
|
0
|
|
Indian
|
19
|
0
|
0
|
0
|
0
|
0
|
0
|
|
General
|
0
|
1
|
0
|
0
|
1
|
1
|
0
|
|
Rotuman
|
0
|
0
|
0
|
0
|
0
|
0
|
1
|
|
Total
|
27
|
32
|
6
|
1
|
2
|
1
|
2
|
Ethnically polarized voting in the 2001 election led to another divisive victory, but this time the winner was the indigenous Fijian-backed Soqosoqo ni Duavata ni Lewenivanua (SDL) party – a new party founded by a coalition of ministers serving in the post-coup caretaker regime – that emerged as the winner of the election.
As in 1999, no indigenous Fijian-supported party won a single Indian seat, and Indian-supported FLP did not win a single Fijian seat. In 1999, the victorious FLP received less than 2 percent of the indigenous Fijian vote; in 2001 the SDL received a mere .1% of the Indian vote.
All of the Indian communal seats went to the FLP. All of the Fijian communal seats, on the other hand, went to one of two indigenous Fijian-supported parties, the SDL or the Matanitu Vanua (MV). The open seats with large indigenous Fijian population also went to either the SDL or the MV. The other open constituencies obtained by the SDL were won on the basis of transfers of party preferences.
The 2001 election (as well as the 1999 election) produced very disproportionate results: the percentages of votes received by the parties were very different from their shares of total seats won. For example, the SDL won 27.5 percent of the vote, but received 45.1 percent of the seats. Table 4, below, reports the percentage of votes and seats won for the parties that actually secured seats.
Table 4: Percentage of Votes and Seats Won, 2001 Parliamentary Election[14]
|
Party
|
Percent of Votes Won
|
Percent of Seats Won
|
|
FLP
|
26.5
|
38.0
|
|
SDL
|
27.5
|
45.1
|
|
MV
|
4.2
|
8.5
|
|
NLUP
|
1.3
|
2.8
|
|
UGP
|
.3
|
1.4
|
|
NFP
|
1.2
|
1.4
|
|
INDP
|
1.4
|
2.8
|
|
Total
|
62.4
|
100.0
|
Some commentators have argued that the reason the results were so disproportionate, and that the 1999 and 2001 elections were decided in the near-parity open seats, is that the proportion of open seats to communal seats is not high enough and the open seats are not well-designed:
“The way electoral districts were drawn…ensured that opportunities for genuine inter-ethnic cooperation were rare. Because only the 25 open electorates enabled multi-ethnic competition, and of these no more than eight were reasonably balanced in their mixture of indigenous Fijian and Indo-Fijian voters, the vast majority of electorate-level contests provided no opportunity at all for cross-ethnic campaigns, appeals or outcomes… The CRC’s recommendation for a “good” proportion of members of both major communities in all open seats was interpreted extremely loosely, to mean ethnic balances of up to 90:10 in some cases, which obviated the need for intra-communal vote swapping. In most seats, clear Indian or Fijian majorities prevailed.” [15]
Other writers (such as Jon Fraenkel in a series of articles discussing the Fiji electoral system) disagree with this assessment and contend that it is the Alternative Vote System that has failed. Regardless of which argument is correct, it is clear that the Fiji system has failed to foster the desired multi-ethnic cooperation.
Conclusion
Since 1970,
when Fiji gained its independence, indigenous Fijians and Indo-Fijians have
voted in separate ethnically based communal constituencies. Voting is
ethnically polarized, and political parties tend to be aligned with one ethnic
group or another. As a result, it is the votes cast in the open constituencies,
where all voters – regardless of race or ethnicity – cast ballots, which have
decided recent elections. This, and the fact that the electoral system depends
on majoritarian voting in single-member constituencies that can distort the
partisan votes to seats ratio, means that constituency boundaries have
important implications in Fiji.
Notes:
[1] This table is based on data reported in
Appendix A and obtained from the
Fiji Elections Office.
[1] Under an Alternative Vote System, electors rank the candidates in order of choice. If no candidate has over 50 percent of the first-preferences, lower order preference votes are transferred until a majority winner emerges. (This system is used in Australia and some other South Pacific Island countries.)
[2] In November 2000, the High Court of Fiji ruled that the military’s abrogation of the 1997 Constitution was illegal.
[3] The 34 senate seats are appointed as follows: 24 are appointed by the Great Council of Chiefs, 9 are appointed by the president, and 1 is appointed by the council of Rotuma.
[4] Although the court can consider objections to a constituency plan, this has not happened to date – no one has brought a claim against a redistribution plan.
[5] The criteria are listed in Chapter 6, Part 2 (Article 52) of the 1997 Constitution.
[6] The next parliamentary elections are not scheduled until September 2006.
[7] This table is based on data reported in Appendix A and obtained from the Fiji Elections Office.
[8] The population quota is obtained by dividing the total population (437146) by the number of seats (46).
[9] Constituency Boundaries Commission, Final Report, September 1998.
[10] Jon Fraenkel, “The Alternative Vote System in Fiji: Electoral Engineering or Ballot-Rigging?” Journal of Commonwealth and Comparative Politics, volume 39 (2), July 2001, page 10.
[11] The data for this table was reported by the Fiji Elections Office.
[12] Had the parties supported by indigenous Fijians agreed to exchange preferences, the FLP would probably not have won nearly as many open seats. However, three ethnic Fijian parties (including the FAP and PANU) consistently put the FLP in second position in their preference lists rather than list each other.
[13] The data was reported by the Fiji Elections Office.
[14] The data for this table was reported by the Fiji Elections Office.
[15] Benjamin Reilly, “Evaluating the effect of the electoral system in post-coup Fiji,” Pacific Ecomonic bulletin, Volume 16 (1), May 2001, page 146.
