Geographical
Information Systems (GIS) store spatial and attribution data
For
redistricting purposes, the spatial data is location-based information; the
attribute data is data that describes a particular location. An example of
spatial data would be the location of a house (spatially known as a point) or
occupied dwelling while examples of attribute data could be the address of the
house, the street name on which it is located, the electoral district in which
it is found and the number of people living in the house to mention only a few.
The ability to relate spatial information to attribute data is what makes GIS a
powerful tool for redistricting purposes.
While there are a number of software packages specifically marketed as redistricting software, whichever package is chosen should contain the following functions to be considered optimal:
- Create/modify/delete new boundaries
- Assign census polygons (counting areas) to new boundaries using a wide variety of methods
- Display running population counts and demographics as census blocks (the smallest population count aggregation area) are assigned to new boundaries
- Display and print maps and reports
- Query and select data
- Validate new boundaries
- Overlay with satellite imagery
- Allow block (counting areas) splitting
- Multi-lingual (tools and reports/maps for countries with more than one ”official” or ”national” language)
- Access to other Geographic data via the Web
Redistricters using GIS software have a variety of sophisticated tools at their disposal for creating district plans. GIS software can be used to draw new districts by assigning geographic units to districts or by moving particular geographic units out of one district and into another. The effects of the reassignment on the population, or any other demographic or political characteristics of the districts, can be immediately reflected on the computer screen as shown in the following screen capture:
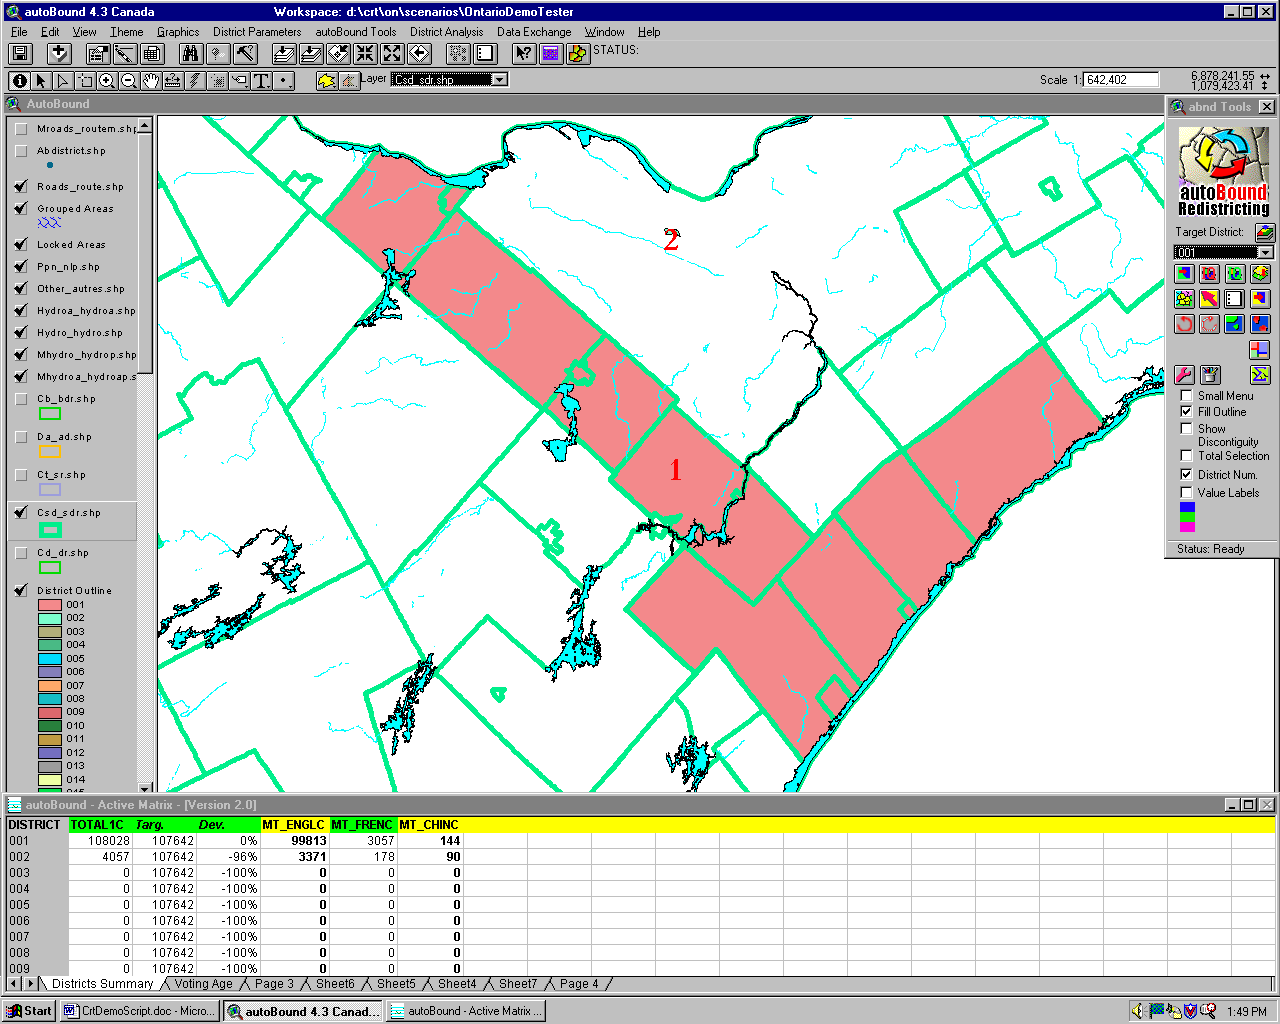
In the above, each boundary line can be dragged to a new location. Each polygon (enclosed area) can be added to the one touching it. The corresponding demographic variables, shown in the table under the map, update automatically.
Once a new plan has been created, the GIS software can produce a map and report of the new district plan or any individual district. GIS software essentially consolidates all redistricting operations into one efficient system.
Limitations of GIS
While GIS is a great improvement over manual redistricting, GIS software does not provide a push button (”push a button and it’s done”) solution to boundary delimitation. The basic activity of redistricting, aggregating census blocks into a new or existing electoral district to approach population equality in the redistricting plan (and mapping the result) is only one requirement in redistricting, albeit the most important. Others factors that may need to be considered include legislation such as the Voting Rights Act in the United States and the Official Languages Act in Canada, minority representation, linguistic representation, racial representation, geographical size (geographically large and/or compact districts), transportation routes, administrative boundaries, community of interest (or identity), historical pattern of a district and contiguity. It would be very difficult to weight the preceding factors to the effect that they could be used efficiently within a GIS system, hence, a great deal of human interaction with the redistricting scenarios generated is required.
Data preparation is also important. Differences in census geography and electoral geography need to be resolved. In most countries, the two geographies are different, that is, census areas do not exactly match electoral areas. A method for reconciling the differences must be established to use the software effectively. Canada has advanced considerably in this area. In the mid 1990s, Elections Canada (EC), the electoral agency, and Statistics Canada (STC), responsible for conducting the census, entertained the idea of building a common database, the National Geographic Database (NGD) that would enable both organizations to conduct their operational business. A diagrammatic representation of that geographical partnership appears below.
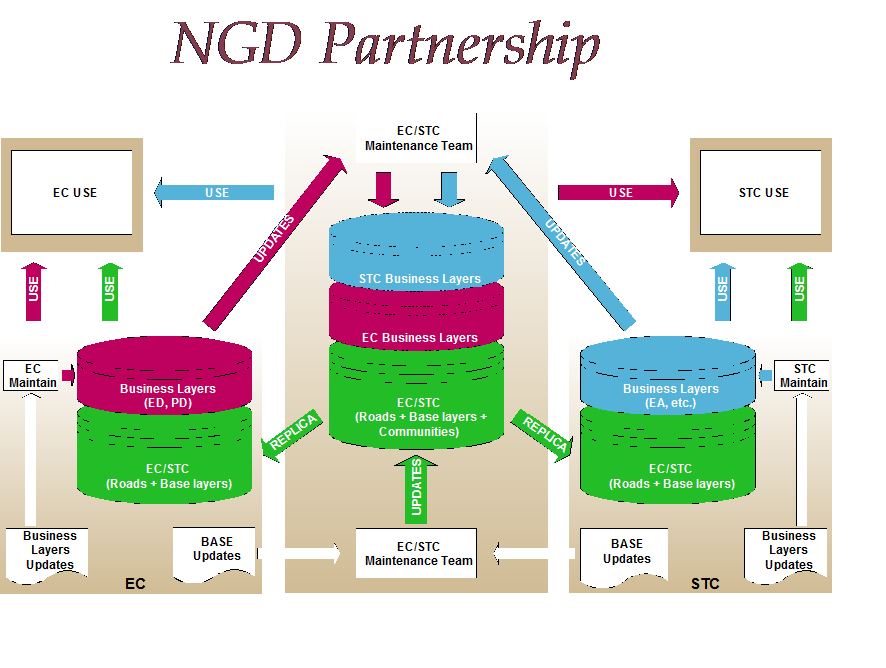
Built on a
common database of roads and addresses and other topographical features such as
hydrology, railroads, power lines (all used in the descriptions of electoral
districts), each organization overlays their business layers onto the base
(electoral districts, polling districts for Elections Canada, census blocks,
enumeration and other collection units for Statistics Canada). Because
the basic geography is the same, each organization can use the other’s business
layer. (Elections Canada uses the census information for redistricting;
Statistics Canada uses the electoral district for reporting the results of the
census.)
Complexity of the software must be considered. The most optimal software packages also require a knowledgeable user. To get a boundary delimitation body operating in as little time as possible, it may be necessary to hire consultants or GIS technicians to assist. Alternatively, the electoral management body, if it is required to assist the boundary authority, may have GIS staff available for that purpose.
Summary
GIS shortens the time required to draw boundary lines and aggregate/display the demographic data related to the map. While GIS can be costly, it may be a cost worth bearing depending on the frequency of redistricting and on the size of the area to be redistricted. The instantaneous feedback and ease of creating multiple scenarios for consideration improves the redistricting process.
An emerging benefit in the use of GIS in redistricting is the capacity to engage the public in the redistricting process. Digitized redistricting data is now accessible though the use of most common web browsers; no special software is required. The public can see the proposed new districts, the current districts, chose to overlay the new district on the current one and see where the differences lie and provide feedback to the boundary authorities. GIS systems can allow the public to ”redline” or mark up an online map and transmit that map, along with comments, to the boundary authority.
Elections Canada noted in an environmental scan (2009) of redistricting software that ”[t]here is, nonetheless, a widespread belief that public participation in redistribution could be increased and improved. All of those involved in the process, from commissioners, to members of Parliament, to the public, have expressed the wish to see the current process for public consultation expanded and updated to reflect the improved communication technology of today.”
In increasing numbers, the public is becoming more spatially aware, nowhere more evident than in the use of Google maps. Where once a novelty, web users today include location mapping and map annotation in their online presence. This provides a natural communication bridge from the public to the boundary authority and back again, all made possible through the use of GIS.
