Nyheim (2009)[1]
argues that the future of early warning lies in adopting and capitalising on
innovative information communication technologies for data collection,
communication, visualisation and analysis. A comparative study of several IT
based tools developed and used by different electoral stakeholders will help to
illustrate common approaches in analysis and presentation of the electoral risk
data.
Instituto
Nacional Electoral (INE) Mexico
is generating electoral risk maps by assessing risks associated with different
factors, including drug trafficking, homicides, robbery, kidnapping, poverty
and electoral complexity. Risk levels are projected on a scale of low, mid or
high risk. Relevant data are generated by INE or obtained through cooperation
and exchange with other government agencies. The risk analysis, presented
through colour-coded geographical maps, is used by INE and other agencies to
ensure conflict-sensitive planning of electoral operations and related security
arrangements. See figure below:

La
Misión de Observación Electoral (MOE) in Colombia is generating
electoral risk maps by analysing the rough data sets, some of which are
produced and made available by the government. MOE undertakes statistical tests
to establish regions in which data deviates. Data sets might include voter
turnout figures. Risk analysis, presented through colour-coded geographical
maps, is used to inform the broader public, including academics and news
agencies, and the government about electoral risks. The established quality of
the analysis has influenced the government’s actions and parliamentary
discussions. See figure below:
 >
>
Centre
for Monitoring Electoral Violence (CMEV) in Sri Lanka is generating online maps of election-related
incidents collected by civil society networks. Factors observed include
incidents relating to voter intimidation, campaigning irregularities, violation
of electoral procedures, threats against electoral monitors and attacks on
candidates. CMEV is presenting this data by placing the static markers on a
Google Map. Markers point to a geographical location where incidents have taken
place. Information is shared publicly, through media and websites, with the
intention to stimulate government action. See below figure:

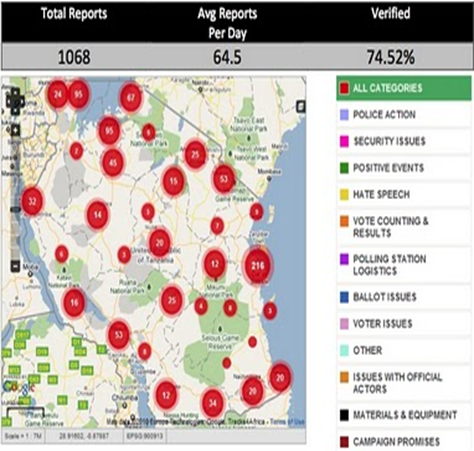
USHAHIDI is an online platform available as a global
public facility. The UCHAGUZI version is customised to gather information on
election-related conflicts and violence. The platform uses Google Maps to
present the data on election-related incidents collected through crowdsourcing.
Data can be presented in the form of static markers, pointing to individual
incidents, or through the aggregate numbers. The platform is used by a number
of civil society organisations to inform public or organisations responsible for
conducting elections. See figure below:
International IDEA’s ‘Electoral Risk Management
Tool’, which is being tested in several countries, is a desktop application
that allows the user to create a country model and populate it with the
relevant factors. Risks associated with the model factors can be presented in
colour-coded maps, trend charts, static markers and aggregated figures shown on
a map. The tool is designed to enhance the early warning and violence
prevention capacity of organisations mandated to organise credible and peaceful
elections, such as EMBs and security sector agencies (SSAs), as well as other
interested organisations. The tool has been offered as a global public good
since 2013. See below figure:

Figure Example of a colour-coded map with
static markers and cumulative factors, accompanied by a trend chart.
This comparative overview portrays the main
IT-based methods for presenting electoral early warning analysis and highlights
their advantages, disadvantages and synergies:
Geographical
colour-coding is used to
present risks associated with given factor(s) in different administrative or
geographical regions. Data are presented on a map, and risk levels are coded in
colour. This type of risk mapping is useful for communicating complex risk
concepts in a simple and understandable way, but the disadvantage is that it
allows only for a snapshot analysis. If the data are collected in successive
rounds, geographical colour-coding cannot provide an insight into changing
trends. This method is therefore particularly useful for illustrating risks
associated with structural factors.
Trend
charting is a widely used
analytical methodology that is applied less often in the field of electoral
violence early warning. Trend charts are useful in providing insight and
communicating information about the dynamic factors whose risk properties may
frequently change. The disadvantage is that it requires methodologically
consistent and frequent data collection, which entails skills, time and
resources. However, the combination of trend charting and geographical
colour-coding methodologies offsets the deficiencies.
Geographical
static markers are valuable
analytical indicators for presenting the dichotomous variables on geographical
maps. Markers pinpoint the location of an incident, enabling focused mitigation
action and prevention of future incidents. The density of static markers in the
region will be indicative of the risk levels and the level of action required.
The disadvantage of this method is that it records events that have already
happened. Furthermore, the presentation of a large number of static markers on
small size maps may be messy.
Aggregated figures presented on geographical
maps are used to point to the dimension of a factor, for example the aggregate
number of incidents in a given region. This methodology may be used to
aggregate, and numerically present, incidents recorded through static markers
and thus improve and simplify their presentation.
Early warning methodologies need ongoing improvement,
with guidelines put in place for evaluating the effectiveness of different
early warning measures. Infrastructure for peace (I4P, elaborated in Part III
1) adds the critical dimension needed for maximising efficiency of electoral
violence early warning, prevention and mitigation. On the other hand, electoral
violence early warning methodologies and tools can be designed with flexibility
to fit different national and electoral contexts; to appeal to diverse pool of
users; and to process different types of data close to real time. Such tools
can be the cement which will strengthen these complex peacebuilding structures.
[1] Nyheim, D. 2009. Conflict and Fragility: Preventing Violence, War and
State Collapse – The Future of Conflict Early Warning and Response’. Paris: OECD.
